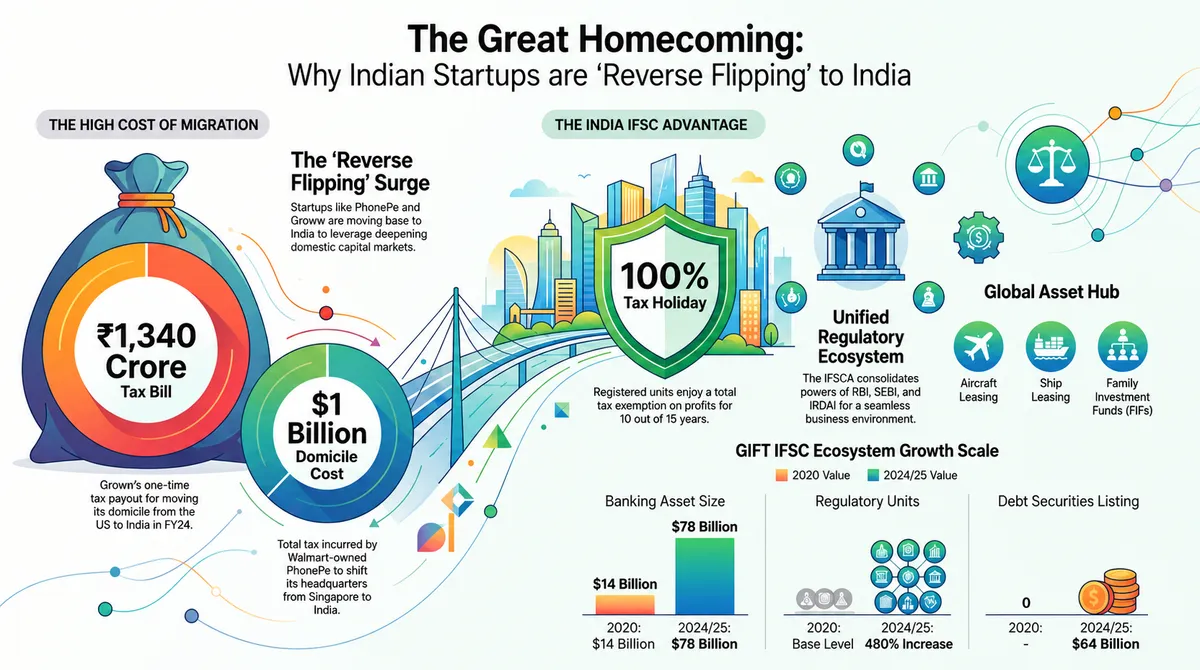
The Performance Metric That Stopped Polishing the Truth
For years, we’ve been lying to ourselves. We stared at our Google Search Console dashboards, saw those green checkmarks for First Input Delay (FID), and patted ourselves on the back. 'Our site is fast,' we told our stakeholders. But deep down, as we navigated our own heavy Single Page Applications (SPAs) on a mid-range Android phone, we knew the truth: the experience was actually terrible. The site was janky, buttons felt stuck, and the UI often froze for half a second while some massive JavaScript bundle executed in the background.
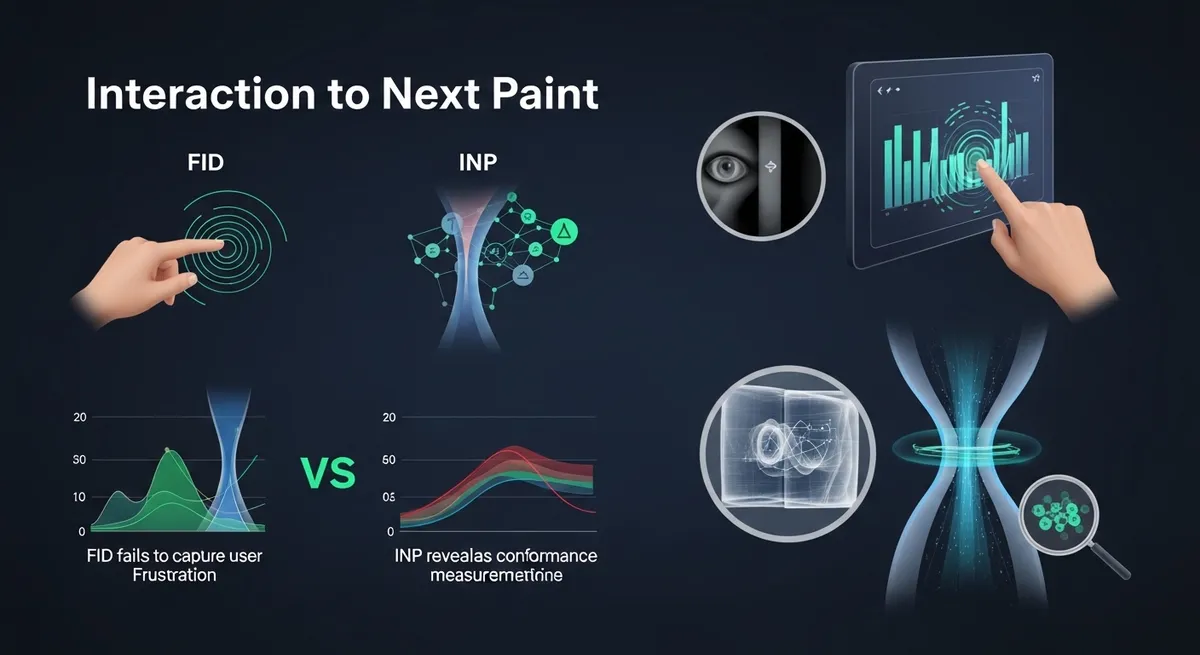
The reason for this disconnect was simple: FID was a vanity metric. It only measured the delay of the very first interaction. If your site managed to respond quickly to that first click but then turned into a slideshow for the next five minutes, FID didn't care. On March 12, 2024, Google finally killed the charade by officially promoting Interaction to Next Paint (INP) to a Core Web Vital. This isn't just another acronym change; it is a fundamental shift in how we define a 'fast' web experience.
Why First Input Delay Failed the Modern Web
To understand why Interaction to Next Paint is so disruptive, we have to look at what it replaced. FID was essentially a measure of 'how busy is the main thread when the user first shows up?' It only captured the time between a user interaction and when the browser could begin processing the event handler. It completely ignored the time it took to actually run the code or, more importantly, the time it took to show the user a visual result.
As SpeedCurve highlights, the disparity in pass rates was staggering. While over 90% of sites cruised through FID with a 'Good' score, the reality on mobile was much grimmer. FID gave developers a false sense of security while ignoring the 90% of user time spent on a page after the initial load. If your React or Vue app spent 400ms rerendering a massive component tree after a button click, FID was blind to that frustration. INP, however, sees everything.
The Anatomy of Interaction to Next Paint
Unlike its predecessor, INP doesn't just look at the start of the race; it looks at the finish line. It measures the entire duration from the moment a user interacts (click, tap, or keypress) until the next frame is actually painted on the screen. This covers three distinct phases:
- Input Delay: How long the interaction waits for background tasks on the main thread to finish.
- Processing Time: The time it takes to run your event handlers in JavaScript.
- Presentation Delay: The time the browser needs to recalculate layout, paint the pixels, and composite the frame.
If any of these stages are sluggish, your INP score suffers. Google defines a 'Good' score as 200 milliseconds or less. According to web.dev, INP aggregates all interactions throughout the entire page lifecycle and reports the worst (or near-worst) latency. This means one heavy, unoptimized search filter can tank your entire page's performance rating, even if the rest of the site is lightning fast.
The SPA Bottleneck: JavaScript Main Thread Optimization
Modern frontend development has a massive main thread problem. We ship megabytes of JavaScript, and every time a user interacts, we ask the browser to do a mountain of work: diffing a Virtual DOM, updating state, and triggering complex CSS transitions. This is where Interaction to Next Paint becomes the ultimate judge of JavaScript main thread optimization.
In a heavy client-side app, a single long-running task can block the main thread for 300ms or more. During this time, the browser is essentially dead to the user. It cannot respond to clicks, it cannot scroll smoothly, and it cannot paint a single frame. INP forces us to break up these 'Long Tasks' into smaller chunks, yielding back to the browser so it can sneak in a paint and keep the UI feeling responsive.
The 'Acknowledge vs. Process' Loophole
As with any metric, developers are already looking for ways to 'game' the system. The most common strategy discussed in performance circles is the 'yield-early' pattern. Since INP only cares about the next paint, you can technically trigger an immediate visual update (like a loading spinner or a button depress state) and then defer the heavy processing to the next tick using setTimeout or requestPostAnimationFrame.
While this might feel like cheating, it actually aligns with good UX principles. A user doesn't necessarily need the final result in 200ms, but they do need an acknowledgment that the system heard them. If your app feels responsive because it shows a 'Processing...' state instantly, the user's perceived performance improves. However, over-relying on this without actually optimizing your code is a band-aid, not a cure.
The Long Animation Frames (LoAF) API: Your New Best Friend
Identifying what exactly is killing your INP is notoriously difficult. Standard profilers can tell you that a task was long, but they often struggle to attribute that task to a specific script or third-party library. This is where the Long Animation Frames (LoAF) API comes in. It provides much more granular data than the old Long Tasks API, allowing developers to see exactly which script caused the delay and why. If a third-party chat widget or a tracking script is blocking your main thread during a critical interaction, LoAF will help you find the smoking gun.
A Note on Tooling and Safari
One major point of contention in the community is the 'Chrome-centric' nature of these metrics. Because INP relies on the PerformanceObserver API and specific paint timing events, it’s primarily a Chromium-driven metric. While it accurately reflects the experience on Chrome and Edge, debugging these issues for Safari users remains a challenge due to limited native support for these specific performance APIs in WebKit. For teams with a heavy iOS user base, this means relying on lab data and 'synthetic' testing to approximate what their mobile users are experiencing.
Conclusion: Stop Hiding Behind FID
The Core Web Vitals transition to INP is a wake-up call for the industry. We can no longer hide behind the fact that our sites 'load' fast if they 'feel' slow once the user starts clicking around. Interaction to Next Paint is the first metric that truly holds us accountable for the entire user journey, not just the first five seconds of a page load.
Optimizing for INP isn't just about chasing a green score in PageSpeed Insights; it's about respecting your user's time and attention. Start by auditing your long tasks, using the LoAF API to find your heaviest scripts, and ensuring your UI provides immediate feedback for every interaction. The era of the 'first interaction' focus is over. It’s time to optimize for the whole experience.
Have you audited your site's INP yet? If you’re seeing a gap between your old FID scores and your new INP reality, it’s time to start breaking up those long JavaScript tasks. Your users—and your SEO rankings—will thank you.